
Pradeo’s Tech team just released its biannual Mobile Applications Threats Review for S1 2017, based on a sample of 1.5 million most recent single applications processed by Pradeo’s engine. Here are some figures resulting from the study. Read the full report here for free.
METHODOLOGY
Pradeo’s engine performs static and dynamic analysis to identify an App's vulnerabilities, data it handles and actions it performs. Then it correlates these data to highlight with a high accuracy how an app behaves once installed on users’ devices.
KEY FINDINGS
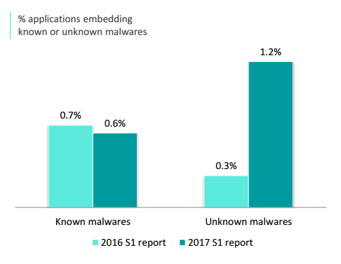
- The volume of unknown malwares quadrupled in one year.
- 60% of Applications feature intrusive behaviors.
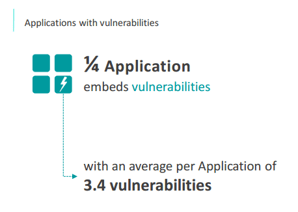
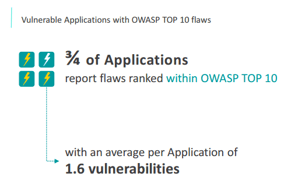
- 1 out of 4 Applications embeds vulnerabilities for which 75% are ranked in the OWASP TOP 10.
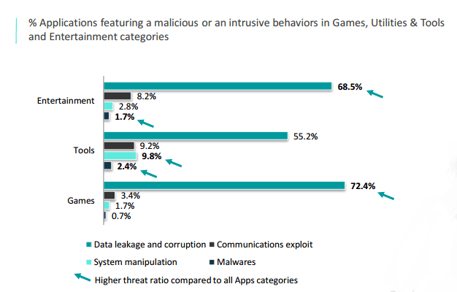
- Games, Entertainment and Tools have higher threat ratios compared to all Apps categories.
APPS TRUE NATURE
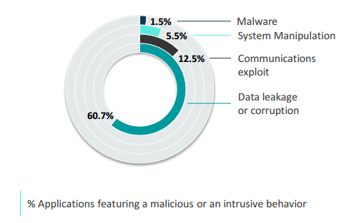
Nowadays, we can find Applications for every purposes; ranking from business activities to a personal day-to-day use, from Games or Entertainment to specific Tools need. Here is the percentage of Applications featuring a malicious or an intrusive behavior.
UNKNOWN MALWARES ARE ON THE RISE
Known malwares represent applications identified as malicious from their viral signature. From S1 2016 to S1 2017, the volume of applications infected by known malwares remains stable whereas unknown malwares doubled. This trend reflects the evolution of the mobile cyber-criminality and the incapacity of an antivirus to properly counter and stop mobile threats. Hackers keep on developing unknown and advanced threats and easily bypass traditional antivirus protections.
Keyloggers, Data Sending Trojans and Screenloggers remain on top of unknown malwares identified within applications. The volume of other unknown malwares increased from 3% to 6% in one year.
Get the year-over-year volume of each malware type in the full report.
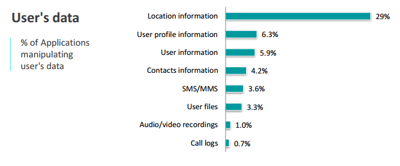
HIGH RATE OF APPS MANIPULATING DATA
60.7% of Applications feature intrusive behaviors which are either legitimate or malicious. These Apps send, delete or modify users’ or devices' information.
This demonstrates the gap between public stores standard security policies and data protection levels expected by companies or individuals.
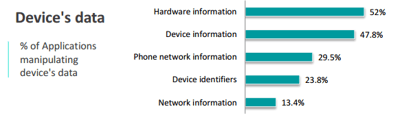
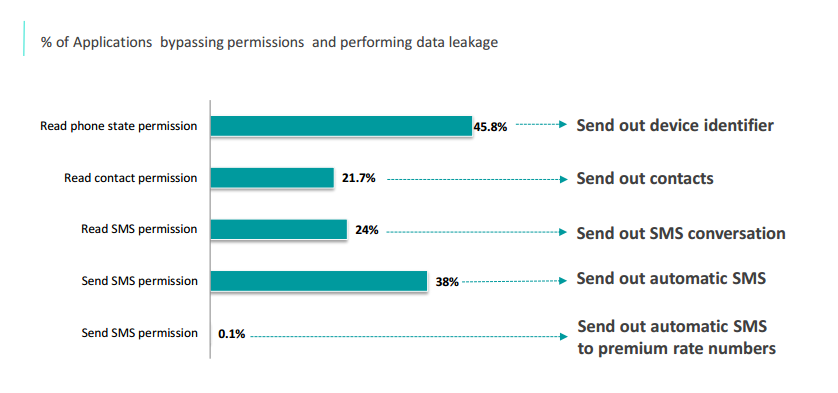
PERMISSIONS: PERMEABLE BOUNDARIES
Despite the nature of permissions, Applications can bypass those boundaries and perform data leakage. Permissions grant the ability for an Application to manipulate a data. They cannot be considered as proper safeguards for data protection nor reflect any risk level to evaluate Applications.
SYSTEM MANIPULATION
Those metrics highlight the ability of some Applications to manipulate their environment. 4% of Applications are exploiting elevated privileges of rooted or jailbroken devices and 2% perform actions on the device such as killing or launching another application‘s process.
COMMUNICATIONS EXPLOIT: SECOND MOST FEATURED THREAT
With 12.8% of Applications exploiting communications, it represents the 2nd nature of threat coming from Applications. 1 out of 10 Applications performs unsecured connections increasing the exposure to network threats. On another hand, 2.6% of Applications make invisible calls or send SMS/MMS causing financial losses when dialing premium rate numbers.
APPLICATIONS VULNERABILITIES: AN OPEN DOOR TO HACKERS
A vulnerability represents a weakness within an Application that could be exploited to jeopardize it. The study identified that 25% of Applications are embedding weaknesses, for which 75% of them are listed in the OWASP top 10 flaws. The implementation of new regulations regarding data privacy protection might positively impact those ratios in the future enforcing companies to include security within their development process.
MOST POPULAR CATEGORIES OF APPLICATIONS TARGETED
Games, Tools and Entertainment Applications are the less safe ones with higher rates of Applications presenting malicious or intrusive behaviors.
ANDROID MORE VULNERABLE THAN iOS
99.6% of new smartphones run Android or iOS Gartner's Q4 2016 figures
Android turns out to be a privileged threat landscape. More permissive than iOS, Android is an easier playground for hackers with a higher propagation rate because of its widespread use. iOS requires more complex hacking techniques to bypass the App store's and user's checks. However, intrusive behaviours also hit a high ratio of iOS Applications. In addition, iOS malwares, though less numerous than Android, still represent an important threat in terms of damages.

-1.png)
-1.png)
-1.png)